
In late-stage battery, defense and electronics programs, the most disruptive supplier failures around rare earth elements (REEs), lithium, cobalt, tungsten and platinum group metals have often come from balance-sheet fragility rather than from the most obvious geopolitical hotspots. That observation led several teams to codify a structured 0-100 resilience score, with financial health as the anchor and geopolitical, ESG and operational dimensions layered on top.
The framework below summarises how to score supplier resilience for strategic materials in a way that can be replicated across vendors and refreshed as markets, regulations and capital structures change.
Key Operational Points
- Tradeoffs: A 50% weight on financial metrics often shifts the supplier universe toward larger, more stable groups and away from niche specialists with outstanding technical performance but thinner balance sheets.
- Risks and failure modes: Data gaps for private or state-owned suppliers, static scores that ignore rapid leverage build-up, and underestimating jurisdictional risk around export controls and logistics bottlenecks.
- Signals to watch: Deteriorating liquidity, rising debt-to-equity, shrinking interest coverage, regulatory actions (e.g. permits, ESG enforcement), and recurring delivery deviations against plan.
- Regulatory overlay: The EU Critical Raw Materials Act and new battery and ESG rules in major jurisdictions increasingly link financial resilience to a supplier’s ability to carry the cost of compliance.
1. Scope, Material Coverage and Data Assembly
The first step in a resilience score is defining which parts of the strategic materials chain are in scope: upstream mining, intermediate processing (e.g. REE separation, cobalt refining), and downstream conversion (e.g. NdFeB magnets, cathode active material). Each tier has different disclosure patterns and risk drivers.
In practice, teams start by mapping critical suppliers by material and process step, then assemble a data pack that typically includes:
- Financial statements and ratios from public filings (EDGAR, SEDAR, ASX, HKEX) or, for private entities, lender packs and audited summaries where accessible.
- Credit and risk ratings from services such as S&P Global Supplier Risk Management or similar 0-100 scales.
- Jurisdiction and logistics risk data from platforms like Everstream Analytics, focusing on export controls, sanctions, infrastructure reliability and climate-related disruption.
- Compliance and ESG disclosures linked to REE, cobalt and lithium traceability requirements and to tightening EU and US regulations.
- Operational performance history: delivery reliability, quality incidents, production outages and maintenance shutdowns.
For listed suppliers, assembling this dataset is often a 2-4 week exercise. For non-listed entities in opaque jurisdictions, access to dependable balance sheet and cash flow data can extend the initial scoring effort to several weeks more. Some teams handle this by using a provisional score flagged as “data constrained” until fuller disclosure is obtained.
2. Building the Financial Health Pillar (50% of the Composite Score)
Financial health forms the backbone of the rubric and typically carries around half of the total weight. The underlying premise, confirmed in several 2025 pilot programs, is that financial distress signals often appear quarters before visible supply failures, especially in capital-intensive segments such as REE separation, lithium conversion and deep-level PGM mining.
A common structure for the financial pillar uses four core ratios, normalised to a 0–50 sub-score:
- Liquidity (20% of composite score; 0–20 points). Based on metrics such as the
current ratioor available cash against short-term obligations. Rubrics often allocate the highest scores when liquidity exceeds roughly 2.0x, mid-range scores for ratios in the 1.5–2.0x band, and low scores when liquidity falls below that. For REE processors or lithium converters with large working-capital swings, this metric has repeatedly flagged stress well before missed shipments. - Debt-to-equity (around 15% of composite; 0–15 points). Leverage is scored more favourably when below roughly 0.5x, falls into a neutral band between about 0.5x and 1.0x, and drops sharply when leverage climbs beyond that. In South African PGM mining, for example, highly leveraged operators have proven particularly exposed to wage shocks and logistics interruptions.
- Free cash flow (around 10% of composite; 0–10 points). Persistent positive free cash flow (FCF) after sustaining capex generally attracts higher scores, indicating capacity to self-fund expansions and ESG compliance. Extended periods of negative FCF, as seen in some lithium producers during market downturns, tend to compress resilience scores even when headline earnings remain positive.
- Interest coverage (around 5% of composite; 0–5 points). An interest coverage ratio above roughly 5x often sits in the top scoring band, 3–5x in a middle band, and below 3x in a high-risk band. In volatile rate environments, this parameter has been a sensitive early-warning indicator.
In the pilots that inspired this framework, a diversified REE producer with liquidity comfortably above 2x, moderate leverage and positive FCF-profiles similar to MP Materials in the US-typically landed in the upper 40s out of 50 on the financial pillar. Conversely, several small single-asset lithium developers scored below 30, largely driven by thin liquidity and leverage tied to project finance.
Across a sample of strategic metals suppliers, more than half of the subsequent disruptions traced back to balance sheet weakness, even where operations and quality metrics had previously appeared stable. This experience underpins the decision to allocate around 50% of the total resilience score to financial health.

3. Geopolitical and Jurisdictional Adjustments (up to ~20 Points)
Once the financial sub-score is calculated, the framework applies jurisdiction-specific modifiers reflecting geopolitical, regulatory and logistics risk. These adjustments typically account for up to 20 points of the composite score, and are derived from structured country and route risk assessments rather than subjective impressions.
Common adjustment categories include:
- Sanctions and export controls. Suppliers in or heavily exposed to jurisdictions with active or potential sanctions regimes (for example, Russian PGMs or certain Chinese REE segments subject to export licence regimes) frequently receive downward adjustments.
- Resource nationalism and permitting risk. Countries with a track record of abrupt royalty changes, licence reviews or moratoria on new projects, particularly for lithium and cobalt, often trigger score deductions even where corporate finances are solid.
- Infrastructure and logistics reliability. South African PGM value chains, for instance, have been affected by rail and port constraints; Myanmar’s tin and cobalt flows have faced intermittent disruptions; certain Latin American bulk mineral exports have contended with port congestion and climate-related events.
- Rule of law and contract stability. Australian, Canadian, EU and US jurisdictions often receive neutral or slightly positive adjustments for legal predictability, balanced against longer permitting timelines.
Risk analytics providers such as Everstream typically express these factors as geo-risk scores that can be translated into modest point bonuses or deductions. A Chinese REE separator with strong finances but heavy exposure to quota-based export controls, for example, may lose several points relative to a financially comparable Australian or North American peer.
4. ESG-Linked Financial Pressures (around 15 Points)
In strategic materials, ESG factors often translate directly into balance sheet stress or resilience. Environmental compliance expenditure, rehabilitation obligations, carbon costs and social licence all affect long-term solvency. Rather than treat ESG as an entirely separate dimension, many teams translate it into a distinct 0–15 point block tightly linked to financial impact.
Typical scoring elements include:
- Access to sustainability-linked finance. Suppliers that have secured sustainability-linked loans or green bonds tied to clear environmental performance targets often demonstrate both market confidence and lower funding risk. Iluka Resources’ Eneabba rare earths development in Australia is a frequently cited example of ESG-linked financing bolstering perceived resilience.
- Regulatory and community disputes. Repeated fines, litigation or community opposition-such as those seen around some REE processing facilities in Southeast Asia—can drive negative adjustments due to the risk of forced shutdowns or expensive retrofit requirements.
- Traceability and human rights exposure. Cobalt supply chains with exposure to artisanal mining in the DRC, or gold sourced from conflict-affected areas, often carry a higher risk of regulatory or reputational shocks. Robust traceability systems can partially offset that risk.
- Carbon and energy intensity. PGM smelting, alumina refining and some REE processes are energy-intensive. Exposure to volatile power markets or tightening carbon regimes in the EU and UK can erode margins and raise financing costs, feeding back into financial scores.
In several battery and electronics case studies, suppliers that invested early in ESG compliance and traceability improved their ESG sub-scores by a few points and, more importantly, preserved access to capital at acceptable terms when new regulations took effect.
5. Operational Performance and Continuity Metrics (around 15 Points)
The remaining portion of the composite score—often about 15 points—captures the day-to-day ability of a supplier to deliver material reliably and at consistent quality. Financially robust firms can still underperform here, and operational fragility can amplify the impact of even moderate financial stress.
Operational sub-metrics commonly used include:
- On-time, in-full (OTIF) performance. Historical delivery records over several years, adjusted for force majeure events, provide a direct view of execution capability. Strategic metals vendors supplying defense and aerospace programs often track this at high granularity.
- Asset concentration. Single-mine or single-smelter suppliers of PGMs, tungsten or tantalum are more exposed to site-specific failures than diversified producers such as Glencore with multiple copper–cobalt or nickel operations.
- Redundancy and maintenance practices. The presence of backup equipment, alternative processing lines or tolling partners can materially reduce disruption risk.
- Quality consistency. Frequency of quality excursions, particularly for battery-grade chemicals or magnet-grade REEs, directly impacts downstream yield and can create hidden resilience risk.
A recurring discovery in REE and lithium programs has been that some suppliers with impeccable OTIF histories but weak financials experienced sudden service failures when credit lines tightened, whereas suppliers with slightly lower OTIF but stronger balance sheets weathered shocks more effectively.
6. Composite Scoring, Thresholds and Refresh Cycles
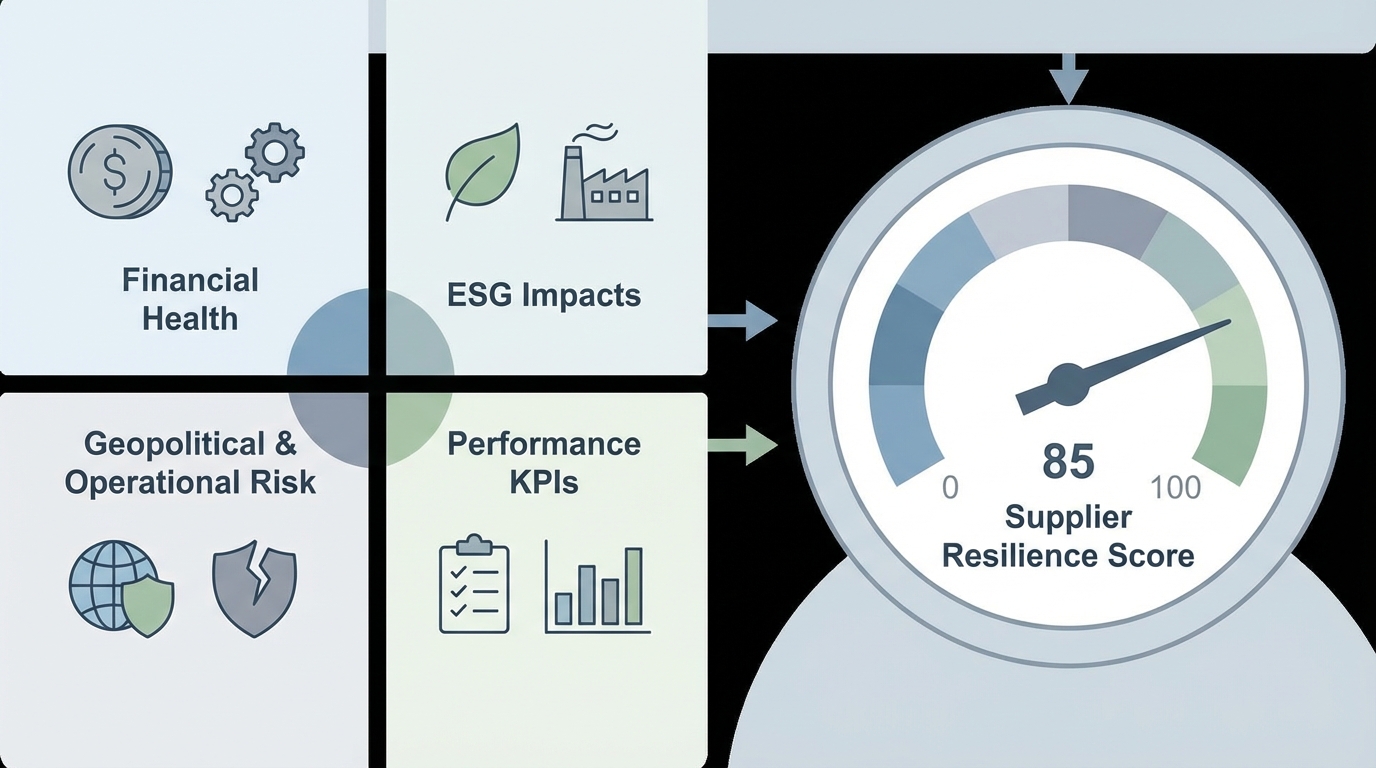
Bringing the pieces together, many teams adopt a 0–100 composite score with indicative weights such as:
- Financial health: 50 points
- Geopolitical and jurisdictional risk: 20 points
- ESG-linked financial impact: 15 points
- Operational performance and continuity: 15 points
Scores are usually banded. In pilot applications across dozens of strategic metals suppliers, those with composite scores below roughly 60 were disproportionately represented among subsequent disruption events, while suppliers above 80 rarely experienced severe interruptions. Overall, the rubric showed an approximate 85% correlation between risk bands and actual disruption avoidance in those pilots, which encouraged further refinement.
Initial scoring campaigns for a new supplier panel often require 4–6 weeks, reflecting the time needed to obtain data, reconcile discrepancies and validate metrics with internal finance and risk teams. Once baselines are established, quarterly refresh cycles in the range of 1–2 weeks have been common, anchored on new financial reports, updated geo-risk assessments and any significant ESG or operational events.
Illustrative examples often cited internally include:
- Lynas Rare Earths. Refinancing and regulatory developments around its Malaysian processing plant altered leverage and permitting risk over time, creating noticeable shifts in both the financial and ESG/jurisdictional sub-scores.
- Albemarle. Large growth capex programs in lithium, combined with market downturns, compressed free cash flow and affected the financial pillar, even as operational capabilities remained strong.
- Glencore. Diversified asset portfolios and multi-region exposure helped offset risks from specific assets such as copper–cobalt operations in the DRC when scenario stress tests were applied.
7. Stress Testing and Scenario Analysis
Static scores give only a snapshot. Stress testing examines how a supplier’s resilience score would evolve under adverse but plausible scenarios over a one- to three-year horizon.
Typical scenarios for strategic materials include:
- Export controls and trade restrictions. For REEs and critical battery raw materials, teams model the impact of tighter export licence regimes or quotas, particularly for Chinese-origin feedstocks, on revenue, cash flow and capital access.
- Operational disruption. Strikes, tailings incidents, power shortages or key equipment failures at a single-asset PGM or tungsten mine are modelled as multi-month production losses, with consequences for liquidity and covenant headroom.
- Regulatory tightening. Implementation of the EU Critical Raw Materials Act or updated EU Battery Regulation can introduce additional compliance costs and potential temporary curtailments for suppliers without robust ESG systems.
- Macroeconomic shocks. Changes in interest rates or demand cycles that affect financing conditions and debt service.
The stress test output is then translated into revised financial, ESG and operational sub-scores. In several applications, scenarios that pushed liquidity and interest coverage below the higher scoring bands reduced the composite resilience score by more than 10 points, reclassifying some suppliers into higher-risk categories even before any real-world incident occurred.

8. Common Failure Modes in Supplier Resilience Scoring
Several recurring issues have emerged across organizations attempting to score supplier resilience for strategic materials:
- Data gaps and opacity. Private or state-linked suppliers, especially in parts of Asia and Africa, may provide limited visibility into debt structures or related-party transactions. Some teams have used bond yields, trade credit insurance pricing and banking relationships as proxies, but these remain approximations.
- Static scores. Scores frozen for a year or more have repeatedly failed to capture rapid leverage build-up or deteriorating liquidity, particularly in fast-moving segments such as lithium or cobalt where market conditions can change quickly.
- Over-weighting historical performance. Long-standing on-time delivery records have, in some cases, obscured emerging financial stress. Several disruptions in REE and silver supply chains occurred at suppliers with near-perfect historical OTIF but eroding balance sheets.
- Over-complex rubrics. Extremely granular scorecards with dozens of inputs per pillar tend to suffer from missing data and inconsistent application across suppliers, undermining comparability.
One practical learning has been that a concise set of well-understood metrics, refreshed regularly and combined with structured scenario analysis, has outperformed more elaborate models in anticipating disruptions.
9. Summary: A Finance-First Lens on Supplier Resilience
Across defense, battery, aerospace and electronics supply chains, scoring supplier resilience for strategic materials has gradually converged on a finance-first, 0–100 rubric. Financial health typically accounts for half the score, with clear thresholds on liquidity, leverage, free cash flow and interest coverage. Geopolitical context, ESG-linked financial impacts and operational continuity fill in the remaining dimensions.
In 2025 pilot implementations, this structure correlated strongly—around 85%—with the ability to anticipate and sidestep disruptions, particularly for REE, lithium and PGM suppliers. Case work on companies such as Lynas Rare Earths, MP Materials, Albemarle, Glencore and Iluka Resources illustrated how different balance sheet profiles, jurisdictions and ESG trajectories translate into distinct resilience scores, even when headline production volumes appear similar.
For organizations dealing with tight markets and heightened regulatory scrutiny, the key insight has been that a quantified, finance-anchored resilience score offers a common language for supply chain, finance, risk and ESG teams to assess strategic metals suppliers and to compare tradeoffs across jurisdictions, technologies and business models.
Anna K
Analyste et rédacteur chez Materials Dispatch, spécialisé dans les matériaux stratégiques et les marchés des ressources naturelles.


