
Q2 2026 Strategic Materials Pre‑Brief: What to Watch This Quarter
Executive Summary
Entering Q2 2026, critical mineral markets sit at an inflection point shaped by four interacting forces: China’s rare earth and technology export controls, Indonesia’s active management of nickel ore supply, structural copper tightness underpinned by electrification and AI infrastructure, and accelerated-but not yet mature-Western efforts to onshore critical mineral value chains.[8][11][25][33][30][62][70][72] Supply bottlenecks for heavy rare earth elements (HREEs), policy‑driven nickel volatility, and a looming copper deficit are the dominant strategic concerns for the coming quarter.
China’s April and October 2025 rare earth measures, including extraterritorial dual‑use controls on magnets containing just 0.1% Chinese rare earths, have driven EU rare earth prices up to six times pre‑restriction levels, with no clear normalization path in 2026.[8][11] Indonesia’s decision to cut 2026 nickel ore mining quotas to 260-270 Mt from a 2025 target of 379 Mt has already triggered a 30%+ price rally, underscoring policy‑driven volatility.[65][62] Meanwhile, S&P Global projects copper demand reaching 42 Mt by 2040 versus a projected 33 Mt production peak in 2030-a 10 Mt structural gap that will begin to tighten markets this decade.[33]
Western policy responses are material but lagging. MP Materials’ $1.25 billion “10X” magnet campus in Texas backed by a 10‑year U.S. Department of Defense offtake with a $110/kg NdPr oxide price floor, the U.S. $10 billion Project Vault strategic minerals reserve, and the EU’s €3 billion RESourceEU program will not substantially ease heavy rare earth or copper constraints before 2027.[29][48][49][52][5][70][72]
For Q2 2026, Materials Dispatch recommends three immediate executive‑level priorities:
- This week: Map Tier 1-3 exposure to Chinese heavy rare earth content in magnets—especially via Japanese magnet suppliers, which account for ~15% of global capacity and are now directly targeted by Chinese export controls.[11][77]
- By end of Q2 2026: Stress‑test copper procurement strategies against U.S. Section 232 tariff scenarios and the drawdown of the 1.5 Mt strategic stockpile accumulated in 2025-26.[1][19][20][61][62]
- By November 2026: Lock in alternative graphite and HREE pathways ahead of the scheduled expiry of China’s graphite export control suspension on November 27, 2026.[25][27]
Risk / Impact / Timing Snapshot
| Risk | Risk Level (Q2 2026) | Impact on Value Chains | Key Timing Markers |
|---|---|---|---|
| Heavy rare earth bottlenecks (yttrium, terbium, dysprosium, lutetium) | High | Persistent price premiums and allocation risk for defense, aerospace, and high‑performance magnets until non‑Chinese separation capacity comes online around 2027.[11][8] | China’s April/October 2025 controls already in force; alternative HREE separation capacity not expected before 2027.[8][11] |
| Policy‑driven nickel volatility | High (price), Medium (physical availability) | 30%+ price swings tied to Indonesia’s annual quota decisions; elevated procurement and hedging risk for stainless and battery supply chains.[65][62] | 2026 quotas (260–270 Mt) already set; potential mid‑year review for major producers such as PT Weda Bay Nickel.[65][62] |
| Copper tariff & structural deficit risk | Medium (Q2), Rising (late‑decade) | Near‑term buffered by >1 Mt exchange inventories and U.S. strategic stock; structurally, a projected 10 Mt annual deficit by 2040 poses systemic risk to electrification and AI infrastructure.[33][61][62][1] | Section 232 copper tariffs announced February 2026; demand/supply gap becomes binding in 2026–2030 window.[19][20][33] |
| Graphite export control snap‑back | Medium | China controls ~75% of natural graphite; end of current suspension could re‑tighten U.S. battery anode supply.[25] | Suspension for U.S. runs to November 27, 2026; Titan’s New York graphite project targets commercial output only by 2028.[25][27] |
The Problem
The core problem entering Q2 2026 is a widening mismatch between the pace of geopolitical constraint, structural demand growth, and the slower ramp of non‑Chinese supply and processing capacity across multiple strategic materials systems.
In rare earths, China’s April 2025 licensing requirements on seven heavy rare earths and the October 2025 expansion to five additional REEs, combined with dual‑use rules covering magnets containing just 0.1% Chinese rare earths, have structurally segmented the market.[8][11] The International Energy Agency reports that EU rare earth prices reached up to six times pre‑restriction levels after these measures, with no visible normalization in the near term.[8] S&P Global data show the largest premiums in yttrium, terbium and dysprosium, precisely the HREEs most important for defense, aerospace, and advanced electronics.[11]
David Merriman of Project Blue expects “the ex‑China market will continue to face bottlenecks in the supply of HREE products over 2026 and 2027 as alternative suppliers of HREEs are constructed and commissioned,” highlighting that alternative separation capacity is not due until 2027.[11] Separation, rather than mining, is the critical bottleneck; even where rare earths are extracted, they cannot serve high‑performance magnet and electronics markets without commercial‑scale separation.[29]
Japan sits at the center of this vulnerability. As the world’s second‑largest permanent magnet producer with roughly 15% of global capacity, Japan’s magnet industry acts as a hub for downstream auto, electronics, and defense supply chains.[11] China’s January 6, 2026 decision to add 20 Japanese firms, including units of Mitsubishi Heavy Industries, to its export control list directly threatens this hub role. A Japanese official warned that if Japan cannot import necessary rare earths, “it will eventually affect all companies downstream in the global supply chain.”[11][77]
On the base metals side, S&P Global projects global copper demand will reach 42 Mt in 2040 versus a projected production peak of 33 Mt in 2030, leaving a 10 Mt supply gap—about 25% of projected demand.[33] Electrification, AI and data center build‑out, and defense spending collectively drive nearly half of copper demand growth, making the deficit a systemic risk to economic and technological development.[33][30] Goldman Sachs forecasts an $11,400/t average copper price in 2026, while combined LME, SHFE, and COMEX copper inventories exceeded 1 Mt in February 2026, underscoring how stockpiling is already being used to buffer this risk.[1][61][62]
Nickel and cobalt illustrate how supply concentration amplifies policy risk. Indonesia accounts for over 60% of global nickel mine supply and now uses annual mining work plan approvals (RKABs) as an active price management tool, cutting 2026 quotas to 260–270 Mt from a 379 Mt target in 2025 and triggering a 30%+ price rally.[65][62] In cobalt, the Democratic Republic of Congo provided roughly 72% of global production in 2025, with Indonesia at 14.9%, and global output is forecast to rise another 6.9% to 352.8 kt in 2026, dominated by these two jurisdictions.[13]
Western governments have launched major responses—the U.S. $10 billion Project Vault strategic critical minerals reserve, the EU’s €3 billion RESourceEU package with magnet scrap export restrictions under preparation, and the MP Materials–DoD magnet campus—but these initiatives will not deliver full‑scale commercial relief before 2027.[5][70][72][29][48][49][52] At the same time, China’s suspension of enhanced graphite export controls to the U.S. until November 27, 2026 and Titan’s New York graphite project targeting 40,000 t/y by 2028 together highlight both a temporary reprieve and the long lead times required for alternative capacity.[25][27]
In Q2 2026, operators face an environment where policy‑driven constraints and structural deficits are already visible, but most non‑Chinese supply responses remain in the planning or early construction phase. The gap between these timelines defines the core risk for procurement and strategic planning.
Current State
The current Q2 2026 landscape is the result of a dense sequence of policy moves, market reactions, and early‑stage industrial responses across 2025–early 2026.
Key Timeline: 2025–Early 2026
April 2025 – China’s first HREE licensing wave. Beijing imposes export licensing on seven heavy rare earths, introducing a new chokepoint for elements critical to magnets, lasers, and advanced optics.[8][11]
October 2025 – Expanded controls and extraterritorial dual‑use regime. A second wave adds five more REEs and introduces dual‑use controls for military end users. Foreign firms must now seek approval to export magnets containing even 0.1% Chinese‑sourced rare earths or manufactured using Chinese technologies, extending Chinese jurisdiction into third‑country supply chains.[8]
November 9, 2025 – Graphite export control suspension for the U.S. China suspends enhanced graphite export controls for shipments to the United States through November 27, 2026, temporarily easing a major bottleneck in battery anode supply.[25] Given China’s roughly 75% share of natural graphite production and dominance in spherical graphite processing, this suspension meaningfully reduces friction for U.S. cell manufacturers—though only for a defined window.[25]
December 2025 – Battery raw material spend rebounds. Estimated monthly spending on EV battery raw materials exceeds $2 billion for the first time since August 2023, driven mainly by rising lithium and nickel prices.[24] Lithium’s share of a key battery metals index, which had fallen to 41% in 2025 from a 72% peak in 2022, is expected to rise again in 2026.[24]
December 2025–January 2026 – Nickel price spike. As Indonesia signals much lower 2026 mining quotas, nickel prices rally by more than 30% from mid‑December 2025 into January 2026.[62] The shift from a three‑year to annual quota (RKAB) approvals allows Jakarta to fine‑tune supply more aggressively.[62]
January 6, 2026 – Japan targeted in China’s controls. China adds 20 Japanese companies, including Mitsubishi Heavy Industries subsidiaries, to its export control list.[77] Given Japan’s ~15% share of global magnet production, this intensifies downstream risk for global automotive, electronics, and defense OEMs reliant on Japanese intermediate products.[11][77]
February 2026 – U.S. Section 232 copper actions and Project Vault. The U.S. government includes copper under Section 232 national security tariffs, placing refined copper and derivative products under import restrictions and setting the stage for protracted trade negotiations.[19][20] In parallel, Washington launches “Project Vault,” allocating $10 billion to establish a Strategic Critical Minerals Reserve aimed at supporting domestic manufacturers.[5]
February 2026 – MP Materials “10X” magnet campus deal. MP Materials announces a $1.25 billion investment to build the “10X” rare earth magnet manufacturing campus in Northlake, Texas, backed by a 10‑year Department of Defense offtake covering 100% of production and a neodymium‑praseodymium oxide price floor of $110/kg.[29][48][49][52] While a major step toward U.S. magnet self‑sufficiency, Mountain Pass ore is rich in light rare earths, and MP’s heavy rare earth separation capabilities remain unproven at commercial scale.[29]
February 2026 – Nickel, copper, aluminum price levels and inventories. On February 26, 2026, LME nickel closed near $17,480/t after a dip to $16,800/t earlier in the month, reflecting quota‑driven volatility.[39][64] Combined copper inventories on the LME, SHFE, and COMEX exceeded 1 Mt for the first time in over two decades, evidencing precautionary stockpiling ahead of tariff implementation and structural deficits.[61][62] Aluminum traded at about $3,121/t, near three‑year highs, supported by smelter disruptions and energy costs even as longer‑term forecasts point to oversupply.[34][64][62]
December 2025 – EU RESourceEU adoption. The EU adopts its RESourceEU initiative, pledging to mobilize €3 billion over 12 months for critical raw materials projects with explicit rare earth focus and announcing plans for mid‑2026 measures to restrict exports of permanent magnet scrap and waste.[70][72]
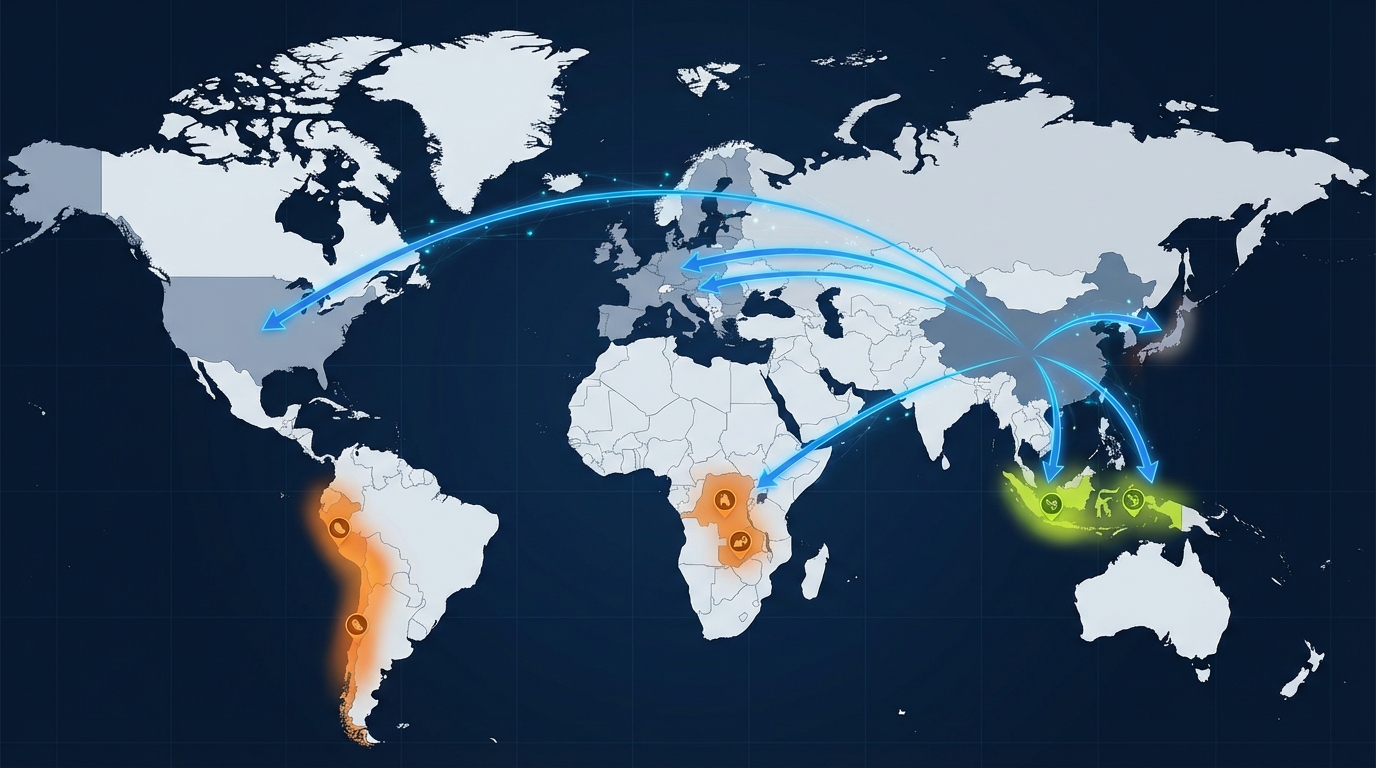
Geographic Flow and Market Mechanics
Rare earths. China remains the dominant source of both light and heavy rare earths and associated magnet technologies. Its dual‑use and technology‑linked export controls now reach deeply into third‑country value chains via the 0.1% content rule, forcing multinational OEMs to trace magnet origin and processing more granularly.[8][11] Japan’s role as a magnet manufacturing hub means that restrictions on Japanese importers of Chinese REEs and technologies propagate rapidly into U.S. and European supply chains.[11][77]
Battery materials. The temporary loosening of China’s graphite controls for U.S. buyers improves near‑term logistics for battery anodes but does not alter the underlying geographic concentration: China still accounts for roughly 75% of natural graphite production and dominates spherical graphite processing.[25] Titan’s graphite mine in New York, backed by fast‑tracked permitting and up to $120 million in U.S. EXIM Bank lending plus a $5.5 million feasibility grant, targets 40,000 t/y of concentrate, roughly half current U.S. natural graphite demand, but only by 2028.[27]
Copper. Copper flows remain diversified, but policy risk is rising. The U.S. strategic stockpile of 1.5 Mt accumulated in 2025–26 and exchange inventories above 1 Mt provide short‑term buffers, but do not resolve the 10 Mt forecast structural deficit by 2040.[1][33][61][62] Tariffs inject uncertainty into where refined copper will be sourced and at what premium.
Nickel and cobalt. Indonesia’s control over more than 60% of nickel mine supply and its move to annual RKAB approvals effectively centralize global class‑2 nickel supply decisions in Jakarta.[62][65] The Democratic Republic of Congo’s roughly 72% share of 2025 cobalt output, rising to 247.7 kt in 2026 on the back of Mutanda and Musonoi mine developments, solidifies a different but equally concentrated risk center.[13]
Collectively, these developments frame Q2 2026 as a quarter where supply is largely adequate in volume terms for many commodities, but subject to increasingly complex policy, licensing, and origin‑control constraints—with heavy rare earths as the most acute near‑term pinch point.
Key Data & Trends
Heavy Rare Earth Premiums and Separation Bottlenecks
Heavy rare earths have seen the sharpest pricing dislocations. S&P Global data show that elements such as yttrium, terbium, and dysprosium command the largest premiums, particularly in ex‑China markets serving defense, aerospace, and high‑performance electronics.[11] The International Energy Agency reports that EU rare earth prices have reached up to six times their pre‑restriction levels following China’s 2025 control waves.[8]
Up to 6×
Increase in rare earth prices in the EU after China’s 2025 export controls [8]
This premium is not just a cyclical spike—it reflects a structural shortage of separated HREEs outside China. As David Merriman notes, ex‑China bottlenecks will extend through at least 2026–27 as alternative suppliers are constructed and commissioned.[11] MP Materials’ Texas magnet campus addresses downstream magnet capacity but does not itself solve heavy rare earth separation, as Mountain Pass ore is light‑REE dominated.[29][48][49][52] For procurement teams, this means that qualification of new HREE sources and recycling streams remains a multi‑year project, not a Q2 2026 lever.
Copper: Demand–Supply Gap Signal
S&P Global’s “Copper in the Age of AI” study underscores the emerging structural gap between demand and supply.[33] Global copper demand is projected to reach 42 Mt by 2040, while mine production is expected to peak at 33 Mt in 2030, leaving a potential 10 Mt shortfall versus projected 2040 demand.[33] Electrification, AI data centers, defense requirements, and potential humanoid robotics deployment collectively drive roughly half of future demand growth.[33][30]
These dynamics can be visualized by comparing projected demand and supply milestones:
Source: S&P Global, "Copper in the Age of AI" [33]
The chart highlights a roughly 25% gap between projected 2040 demand and 2030 peak production.[33] In Q2 2026, this gap is not yet expressed as physical scarcity: exchange inventories exceed 1 Mt and the U.S. has accumulated a 1.5 Mt strategic stockpile.[61][62][1] However, traders and procurement teams should treat any sustained drawdown in these buffers as an early warning of tightening fundamentals against a structurally constrained mine project pipeline.
Nickel: Indonesia’s Quota Leverage
Indonesia’s shift to annual RKAB approvals and its 2026 quota cut are central to nickel’s current volatility. For 2025, the mining target was 379 Mt of nickel ore; for 2026, authorities set a range of 260–270 Mt—a reduction of about 11% in permitted mine supply.[65][62] PT Weda Bay Nickel, the world’s largest nickel mine, saw its quota reduced from 42 Mt in 2025 to 12 Mt in 2026, despite planning output above 60 Mt.[65]
The scale of this adjustment is captured below:
Source: Indonesian government statements; company disclosures [65][62]
This deliberate tightening sparked a 30%+ nickel price rally between mid‑December 2025 and January 2026 and underpins Goldman Sachs’ upgraded 2026 price forecast of $17,200/t as of February 16, 2026.[62] Yet fundamental nickel demand faces headwinds from the rapid adoption of lithium‑iron‑phosphate (LFP) batteries, which surpassed nickel‑based chemistries in global EV deployments in 2025.[73] The implication is that nickel prices in Q2 2026 are highly sensitive to Indonesian policy adjustments rather than to unambiguous demand growth, creating asymmetric downside risk if quotas are loosened.
Cobalt: DRC Concentration Risk
Global cobalt output grew an estimated 8.0% in 2025 to 330 kt, driven by expansions in the Democratic Republic of Congo and Indonesia, and is forecast to rise a further 6.9% to 352.8 kt in 2026.[13] The DRC remains dominant with roughly 72% of 2025 production, followed by Indonesia at 14.9%.[13] DRC output is projected to increase 4.4% to 247.7 kt in 2026, supported by Glencore’s Mutanda mine and the ramp‑up of Musonoi.[13]
The geographical concentration can be visualized as:
Source: GlobalData cobalt supply estimates [13]
For Q2 2026, cobalt availability at the mine level appears robust, but political and ESG risk in the DRC and Indonesia remains high. Procurement teams should not misinterpret volume growth as risk diversification; instead, they must prepare for potential disruptions concentrated in very few jurisdictions while tracking battery chemistry shifts that could alter long‑term cobalt demand.[13][73]
Aluminum: Near‑Term Tightness, Medium‑Term Surplus
China’s primary aluminum capacity has been capped at 45 Mt since 2017, with production of approximately 43.8 Mt in 2024, leaving limited room for expansion within the cap.[31] Simultaneously, Chinese firms are investing aggressively in smelters abroad. Goldman Sachs projects Indonesian aluminum output tripling from 0.8 Mt in 2025 to nearly 2.8 Mt by 2027, contributing to a likely global surplus.[62]
These dynamics are contrasted below:
Source: Chinese production statistics; Goldman Sachs forecasts [31][62]
Despite current LME prices around $3,121/t, supported by smelter disruptions and high energy costs, Goldman Sachs forecasts aluminum falling to $2,350/t by end‑2026 and $2,400/t in 2027 as new capacity, particularly from Indonesia, comes online.[34][64][1][62] For Q2 2026, buyers face the paradox of tight spot markets underpinned by localized disruptions and tariffs (including 50% U.S. aluminum tariffs) set against a medium‑term oversupply trajectory.[34][62]
Battery Metals & Graphite: LFP Shift and a Defined Planning Window
Lithium demand has rebounded, with December 2025 seeing EV battery raw material spending above $2 billion for the first time since August 2023.[24] However, the EV transition is shifting technologically: LFP batteries, which contain lithium but no nickel or cobalt, surpassed nickel‑based chemistries in global EV deployments in 2025.[73] This trend dampens long‑run demand growth for nickel and cobalt while reinforcing lithium’s centrality.[24][73]
Graphite, meanwhile, presents a clear planning horizon. China’s suspension of enhanced graphite export controls for U.S. shipments until November 27, 2026 temporarily reduces licensing friction and stabilizes supply for U.S. anode producers.[25] But given China’s ~75% share of natural graphite production and dominance in spherical processing, a post‑November 2026 snap‑back would immediately re‑tighten this market.[25] Titan’s New York project, aiming for 40,000 t/y—roughly half current U.S. natural graphite demand—by 2028, illustrates both the scale of the opportunity and the long development lead times.[27]
Risks & Scenarios
Materials Dispatch outlines three working scenarios for Q2 2026 through late‑2027, structured to support hedging, contracting, and investment decisions. Probabilities are qualitative, reflecting our synthesis of the cited data rather than precise statistical forecasts.
Scenario 1 – Managed Constraint (Base Case, Most Likely)
Summary. China maintains current rare earth export controls and graphite suspension terms; Indonesia adheres broadly to announced nickel quotas; Western policy initiatives advance but remain in build‑out. Markets experience elevated but manageable constraints.
Rare earths. HREE premiums remain high, particularly in ex‑China markets, reflecting ongoing separation capacity shortages and Chinese licensing constraints.[8][11] Japan’s magnet sector continues to operate with friction but without outright embargoes, propagating higher costs and lead‑time risk to downstream OEMs.[11][77]
Copper. Copper trades broadly within the range implied by Goldman’s $11,400/t 2026 forecast, underpinned by strong long‑term demand expectations and buffered in the near term by >1 Mt exchange inventories and the U.S. strategic stockpile.[1][33][61][62] Section 232 tariffs constrain trade patterns but do not yet precipitate acute shortages.[19][20]
Nickel & aluminum. Nickel prices remain volatile but anchored around current spot and forecast levels as Indonesian quotas are neither dramatically cut nor expanded.[39][64][62] Aluminum prices stay elevated relative to longer‑term forecasts due to energy costs and localized disruptions, even as forward curves price in surplus from Indonesian and other capacity expansions.[34][62][31]
Implications. This scenario favors conservative but not extreme risk management: diversified sourcing, incremental inventory builds in the most exposed segments (HREEs, select battery inputs), and cautious use of financial hedging to lock in forward prices near forecast ranges, particularly for copper and nickel.[1][62]
Scenario 2 – Policy Escalation & Fragmentation (Downside)
Summary. Geopolitical frictions intensify. China tightens enforcement of rare earth and technology controls—potentially broadening coverage to additional downstream magnet and motor products—or accelerates the end of graphite export leniency. The U.S. hardens Section 232 tariffs on copper and aluminum, and Indonesia further cuts nickel quotas or delays approvals.
Rare earths. More aggressive enforcement of the 0.1% content rule or additional Japanese entities added to China’s export control list would exacerbate shortages of qualified magnet materials.[8][77] EU rare earth prices, already up to six times pre‑restriction levels, could spike further, forcing rationing for defense and high‑reliability applications.[8][11]
Copper. If Section 232 tariffs are implemented more forcefully or extended to additional copper‑containing goods, trade flows could be disrupted even with high inventory levels, creating regional dislocations and potentially pushing prices above current forecast ranges.[1][19][20][61][62] Stockpile drawdowns could accelerate, compressing the buffer ahead of the 2030 production peak.[33]
Nickel & cobalt. Further Indonesian quota cuts or delays to mid‑year RKAB revisions could provoke another 30%+ nickel price spike from current levels.[62][65] Any major disruption in the DRC—political, regulatory, or ESG‑driven—would have outsized impact on cobalt markets given its ~72% share of global supply.[13]
Implications. Under escalation, contract optionality and geographic diversification become paramount. OEMs and tier suppliers would need to activate contingency sourcing outside China and Indonesia where possible, consider material substitution (e.g., LFP over nickel‑rich chemistries where performance constraints allow), and build higher precautionary inventories in HREEs and select battery metals despite working‑capital costs.[24][73][11]
Scenario 3 – Managed De‑Risking & Incremental Relief (Upside)
Summary. Policy tensions ease marginally. China maintains existing controls but signals greater predictability in licensing; the graphite suspension is extended or broadened; Indonesian nickel policy shifts toward stability; and Western capacity initiatives stay on or ahead of schedule.
Rare earths. Even in a “relief” scenario, heavy rare earth constraints persist given that alternative separation projects are not expected to be fully operational until 2027.[11] However, more consistent Chinese licensing and closer coordination with Japanese and Western buyers could cap further price escalation and reduce lead‑time uncertainty.[8][11][77]
Copper & aluminum. If Section 232 copper measures are moderated through negotiations and energy costs ease, near‑term price pressure could abate, leaving copper and aluminum prices closer to or below current forecasts while structural deficits (for copper) and surpluses (for aluminum) remain on the horizon.[1][33][62][31][34]
Battery metals. Clarity on EV incentives and tariff regimes could support steadier lithium demand growth without reigniting the 2022 price spike, while continued LFP penetration gradually reduces systemic dependence on nickel and cobalt.[24][73] Graphite supply risk would diminish if suspensions are extended or alternative projects like Titan’s remain on schedule for 2028.[25][27]
Implications. In an upside scenario, buyers could opportunistically extend tenors on key contracts at more favorable prices, especially for copper and nickel, while reallocating some risk‑management budgets from inventory to strategic partnerships and R&D for substitution and recycling. Nonetheless, HREE and copper structural constraints suggest maintaining core resilience measures even under this more benign path.[11][33]
Risk Matrix Overview
| Risk | Probability (Q2 2026) | Impact | Primary Timeframe |
|---|---|---|---|
| Persistent HREE shortage | High | High impact on defense, aerospace, advanced electronics; sustained price premiums and qualification bottlenecks.[11][8] | Immediate through at least 2027 |
| Nickel price shock from quota changes | Medium | High price volatility for stainless and battery sectors; procurement cost spikes.[65][62] | Q2 2026–2027 (aligned with RKAB cycles) |
| Copper trade/tariff disruption | Medium | Medium–High regional price and availability impacts, especially in the U.S.[1][19][20][61][62] | Q2 2026 onward; intensifying as inventories run down |
| Graphite control snap‑back | Medium | Medium–High impact on U.S. battery anode supply chains given 75% Chinese production share.[25] | Late 2026–2028 (post‑suspension; before new projects ramp) |
| Aluminum oversupply & price compression | High (medium‑term) | Mixed: lower input costs for consumers; margin pressure for smelters.[31][62][34] | 2027–2030 as Indonesian capacity ramps |
Actionable Intelligence
Do Now (This Week)
- Map rare earth and magnet exposure at Tier 2/3 level. Direct each business unit to identify components containing permanent magnets sourced from Japan or China, noting whether neodymium‑praseodymium or heavy rare earths (terbium, dysprosium) are involved.[11] Pay particular attention to supplies passing through Japanese firms the Chinese government has added to its export control list.[77]
- Establish a licensing and origin‑tracking task force. Under legal/compliance leadership, set up a process to document magnet origin and technology lineage against China’s 0.1% rare earth content rule and dual‑use restrictions.[8] This should cover not just direct imports from China, but also magnets manufactured using Chinese technologies in third countries.
- Set concrete monitoring thresholds for copper and nickel. For copper, benchmark procurement strategies to Goldman’s $11,400/t 2026 forecast and the current >1 Mt inventory buffer; trigger review if prices move materially above forecast while inventories decline.[1][61][62] For nickel, treat significant deviations from the $17,200/t annual forecast as prompts to reassess exposure, given Indonesia’s quota leverage.[62]
Do in Q2 2026
- Renegotiate or re‑structure magnet and REE contracts. For critical magnet and HREE inputs, prioritize longer‑tenor contracts with suppliers that can demonstrate diversified feedstock beyond China, even at premium pricing.[11] Where possible, structure contracts to share upside/downside around reference prices in EU or U.S. markets, acknowledging current premiums up to six times pre‑restriction levels.[8]
- Align with Western policy initiatives and funding streams. Engage with U.S. agencies managing Project Vault and with EU RESourceEU channels to understand eligibility for offtake, co‑investment, or risk‑sharing for critical mineral projects.[5][70][72] For U.S. defense‑linked demand, coordinate with integrators that may access MP Materials’ forthcoming magnet output under the 10‑year DoD offtake.[29][48][49][52]
- Rebalance battery chemistry and sourcing strategies. Given LFP’s overtaking of nickel‑based chemistries in 2025 EV deployments, work with battery and vehicle engineering teams to map where LFP adoption is technically feasible without compromising performance.[73] Use this to gradually reduce exposure to Indonesian nickel and DRC cobalt while maintaining flexibility to shift chemistries if policy or market conditions change.[62][13]
Do by End‑2026 (Strategic Positioning)
- Secure non‑Chinese graphite pathways before November 2026. Use the current suspension of Chinese graphite export controls to diversify relationships with alternative suppliers and to negotiate preliminary offtake or partnership agreements with projects such as Titan’s New York mine, which targets 40,000 t/y by 2028.[25][27] Aim to have at least one non‑Chinese graphite source qualified per key battery program by late 2026.
- Invest in HREE recycling and substitution R&D. In anticipation of continued HREE bottlenecks through 2027, support internal or joint‑venture R&D efforts on magnet recycling, reduced dysprosium content designs, and alternative motor technologies that can operate with lighter rare earths or different materials.[11][29] Leverage EU plans to restrict export of magnet scrap and waste as a potential feedstock opportunity for European operations.[70][72]
- Prepare for divergent aluminum and copper trajectories. For aluminum‑intensive product lines, plan around downward price pressure from 2027 onward as Indonesian capacity ramps, potentially using this to negotiate longer‑term, lower‑cost supply agreements.[31][62] For copper‑intensive infrastructure, assume that today’s inventory‑cushioned environment is temporary; prioritize early engagement in new copper offtake agreements or strategic alliances with miners and recyclers ahead of a tightening post‑2030 market.[33][1]
Signals to Watch
For Q2 2026, Materials Dispatch recommends that procurement, trading, and risk teams institute weekly checks on the following indicators, with predefined internal triggers for escalation:
- Heavy rare earth price benchmarks (EU and U.S.). Track dysprosium, terbium, and yttrium prices relative to the six‑times pre‑restriction levels flagged by the IEA.[8] A renewed acceleration from already elevated levels would suggest tightening Chinese licensing or additional downstream controls.[8][11]
- Chinese export licensing and entity list updates. Monitor MOFCOM announcements for changes to rare earth, magnet, or technology export rules, especially any additions to the Japanese company list or shifts in graphite licensing ahead of the November 27, 2026 suspension expiry.[8][25][77]
- Indonesian nickel RKAB revisions. Watch for mid‑year adjustments to 2026 quotas, particularly for PT Weda Bay Nickel, whose quota has already fallen from 42 Mt in 2025 to 12 Mt in 2026.[65] Any further cuts or approval delays are likely to trigger renewed price volatility.[62]
- Copper inventories and U.S. tariff developments. Track combined LME/SHFE/COMEX inventories and U.S. policy statements under Section 232.[19][20][61][62] A simultaneous inventory drawdown and hardening of tariff measures would mark a transition from buffered to structurally tight conditions.
- Project milestones for Western graphite and rare earth projects. Follow permitting, financing, and construction updates for Titan’s New York graphite mine, MP Materials’ “10X” magnet campus, and EU‑backed RESourceEU projects.[27][29][70][72] Slippage against announced timelines would extend dependence on Chinese supply beyond current planning assumptions.
Sources
[1] Source [1] — URL not publicly provided.
[5] Source [5] — URL not publicly provided.
[8] Source [8] — URL not publicly provided.
[11] Source [11] — URL not publicly provided.
[13] Source [13] — URL not publicly provided.
[19] Source [19] — URL not publicly provided.
[20] Source [20] — URL not publicly provided.
[24] Source [24] — URL not publicly provided.
[25] Source [25] — URL not publicly provided.
[27] Source [27] — URL not publicly provided.
[29] Source [29] — URL not publicly provided.
[30] Source [30] — URL not publicly provided.
[31] Source [31] — URL not publicly provided.
[33] Source [33] — URL not publicly provided.
[34] Source [34] — URL not publicly provided.
[39] Source [39] — URL not publicly provided.
[42] Source [42] — URL not publicly provided.
[45] Source [45] — URL not publicly provided.
[48] Source [48] — URL not publicly provided.
[49] Source [49] — URL not publicly provided.
[52] Source [52] — URL not publicly provided.
[53] Source [53] — URL not publicly provided.
[57] Source [57] — URL not publicly provided.
[61] Source [61] — URL not publicly provided.
[62] Source [62] — URL not publicly provided.
[64] Source [64] — URL not publicly provided.
[65] Source [65] — URL not publicly provided.
[70] Source [70] — URL not publicly provided.
[72] Source [72] — URL not publicly provided.
[73] Source [73] — URL not publicly provided.
[77] Source [77] — URL not publicly provided.
Anna K
Analyste et rédacteur chez Materials Dispatch, spécialisé dans les matériaux stratégiques et les marchés des ressources naturelles.


