
In advanced manufacturing, battery, and aerospace programs, several disruptions since 2020 have shown how little visibility many organisations have into their dependence on strategic materials. When export controls on gallium and germanium tightened, and when individual mines in the Democratic Republic of Congo or South Africa paused operations, procurement teams often discovered only at that point how deeply embedded those materials were in components and subsystems. The 10-step framework below reflects approaches seen in practice for mapping exposure across rare earth elements (REEs), battery metals, and precious and platinum-group metals.
The emphasis is on method rather than prescription: how teams have scoped exposure, traced dependencies down to Tier 3 and beyond, scored risks, and translated findings into governance structures compatible with regimes such as U.S. Executive Order 14017, the EU Battery Regulation, and the Uyghur Forced Labor Prevention Act (UFLPA).
Operational signals and tradeoffs to track
- Key tradeoff: Granular Tier 3+ mapping increases resilience but often extends timelines; many programmes balance depth of tracing against speed of initial risk scanning.
- Frequent failure mode: Exclusive reliance on Tier 1 self-reporting, with no independent cross-check against logistics data, customs records, or third-party audits.
- High-signal indicators: New export quotas, sanctions, or environmental enforcement actions in countries that dominate a given material (e.g., China for REE separation, DRC for cobalt).
- Compliance trigger: Any indication that material flows intersect UFLPA-designated regions or entities, or fall under emerging EU Battery Regulation recycled-content thresholds.
- Structural vulnerability: Concentration of refining or chemical conversion in a single jurisdiction even where mining is geographically diversified.
Prerequisites and context for a 10-step exposure map
Before the formal “steps” begin, many organisations converge on a few enabling conditions. Contract reviews often surface clauses dealing with material provenance, force majeure tied to sanctions or tariffs, and audit rights extending beyond Tier 1. In critical minerals programmes, certificates of analysis (CoA) specifying grade and purity – for example, neodymium-praseodymium (NdPr) oxide at >99.5% purity – appear frequently as reference documents for both engineering and compliance teams.
Due diligence baselines tend to draw on existing industry schemes. For 3TG (tin, tantalum, tungsten, gold), the Responsible Minerals Initiative (RMI) Chain-of-Custody and smelter/refiner audit protocols are commonly leveraged and then extended to lithium, nickel, or cobalt via schemes such as the Initiative for Responsible Mining Assurance (IRMA). In parallel, regulatory drivers create their own data expectations: EO 14017 has pushed U.S. defence-adjacent companies to inventory critical minerals usage; the EU Battery Regulation introduces recycled-content and carbon-footprint disclosure obligations; UFLPA screens routes touching Xinjiang-linked mining or processing, including some REE and polysilicon assets.
Operationally, cross-functional teams are typical: procurement, legal, engineering, logistics, and sustainability working from a shared data model. General observations from multi-tier mapping exercises indicate that complete maps for complex product portfolios often require three to six months, with Tier 3 data access consuming 60-90 days and geopolitical scenario modelling another 30–45 days. Common obstacles include siloed data systems and inconsistent supplier identifiers across ERPs and compliance tools.
Step 1 – Define strategic materials scope and internal demand
The first methodological step in most programmes is a clear definition of which materials are treated as “strategic” and the internal demand baseline for each. Many teams cross-reference the U.S. Geological Survey Critical Minerals List and comparable EU lists against bills of materials (BOMs) and process specifications. Materials are typically logged not only by element (e.g., dysprosium, lithium, palladium) but also by form and grade – such as battery-grade lithium carbonate (>99.5% Li2CO3) versus technical-grade carbonate.
Frameworks like the Risk Assessment and Mitigation Framework for Strategic Materials (RAMF-SM) often treat this as the “derived demand” phase: mapping how many tonnes of a given material are implied by planned EV battery output, turbine production, or semiconductor wafer starts. In one aerospace example, turbine coating programmes quantified demand for high-purity platinum sponge in the low single-digit tonnes per year, almost entirely linked to South African and Russian supply, immediately flagging concentration risk.
A recurrent bottleneck at this stage is reconciling engineering documentation with procurement data: part numbers, material codes, and supplier SKUs frequently misalign. Without this reconciliation, later exposure metrics rest on fragile foundations.
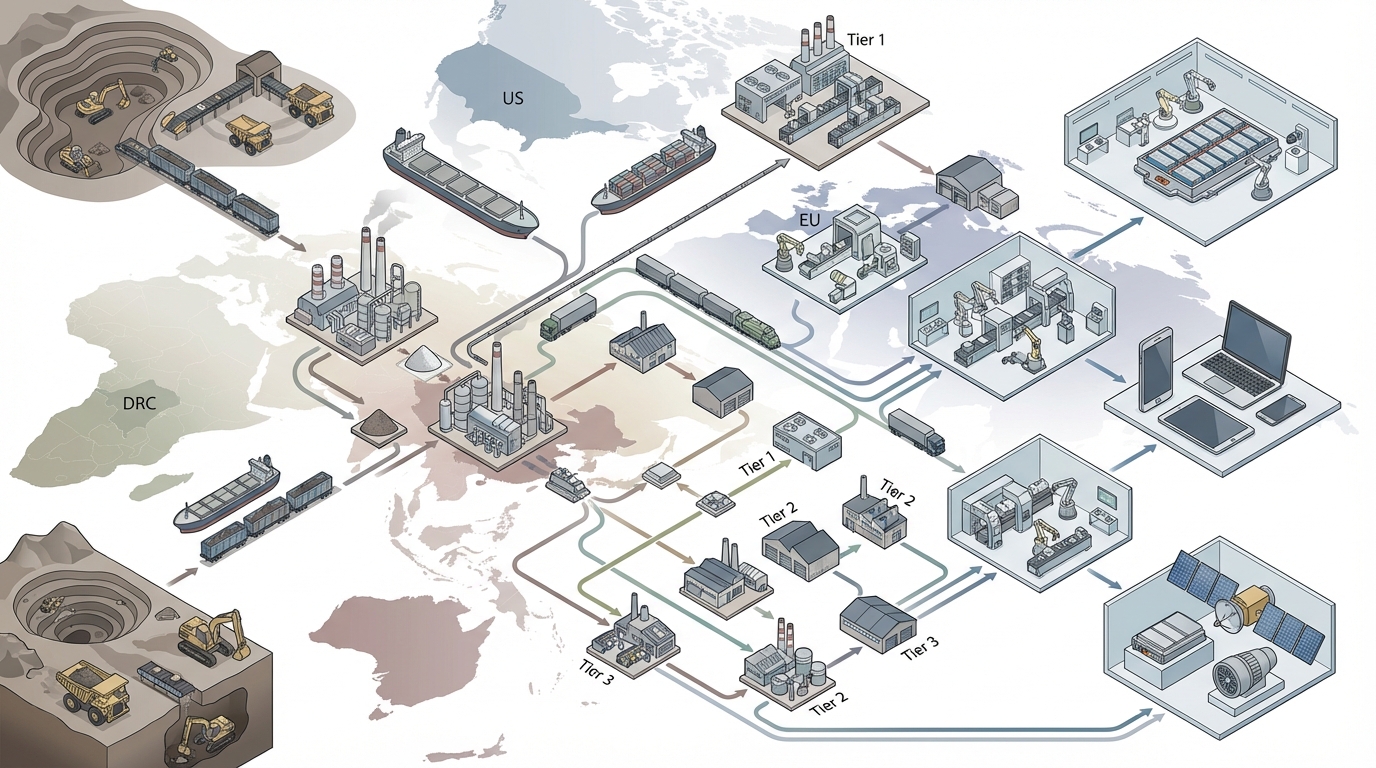
Step 2 – Map the inbound supply chain to Tier 3 and beyond
Once critical materials and demand are defined, attention typically shifts to mapping the physical and contractual path from mine to component. Value-chain mapping approaches, such as those popularised in consulting toolkits, are used to list each node: mine, concentrator, refinery, chemical converter, alloy producer, component manufacturer, and final assembly.
Examples observed in practice include tracing NdPr from Lynas Rare Earths’ Mt Weld operation in Australia through its Malaysian separation plant and onward to magnet makers in Japan or Europe. Another recurrent case involves cobalt flows from Glencore’s Mutanda mine in the DRC, through Chinese refiners, into cathode active materials used by cell manufacturers. In both examples, mining is only one part of the story; exposure is frequently dominated by the jurisdiction hosting separation or refining, with China’s share of REE separation capacity and cobalt refining capacity acting as a structural risk factor.
Where suppliers are unwilling or unable to disclose full Tier 3+ details, teams often triangulate using customs data, public sustainability reports, and RMI or IRMA audit disclosures. A major failure mode at this stage is accepting generic statements such as “sourced responsibly” without verifying the actual facility list.
Step 3 – Classify suppliers and routes by risk tier
With an initial map in place, many organisations then assign high/medium/low risk tiers to suppliers, sites, and trade routes. Typical criteria include: impact on revenue or mission if disrupted, likelihood of disruption (geopolitics, ESG controversies, natural hazards), and current level of preparedness or redundancy.
For instance, a lithium hydroxide supplier sourcing material from Albemarle’s Greenbushes deposit via a single export port prone to industrial action may be rated higher risk than a PGM recycler such as Umicore with multiple plants and diversified feedstock. Cobalt units refined in regions with acute child-labour scrutiny often receive heightened attention because a single NGO report or regulatory action can render material unusable for sensitive end-customers.
Simple risk matrices-likelihood multiplied by impact, adjusted for preparedness-are frequently employed. The important pattern is consistency: the same criteria applied across all materials, so that lithium, indium, and palladium exposures can be compared on a like-for-like basis.
Step 4 – Assess material-specific global supply vulnerabilities
The next layer adds an external lens: how fragile is the global supply picture for each material, independent of one company’s footprint? Here, concentration of mining or refining, projected deficits, and exposure to export controls are central.
Public analyses have pointed to potential lithium deficits on the order of 150,000–200,000 tonnes LCE around 2025 in some scenarios, driven by delayed Andean brine expansions and slower-than-expected conversion capacity. Gallium and germanium have been subject to Chinese export licensing requirements, raising concerns for defence and high-end electronics programmes reliant on those inputs. For silver, large single assets such as Newmont’s Peñasquito mine in Mexico illustrate how localised disputes over water or taxation can temporarily remove a significant share of supply from the market.
At this stage, exposure mapping exercises often overlay internal demand against such macro-vulnerability profiles to identify which materials warrant deeper mitigation analysis, even if current sourcing appears stable.

Step 5 – Quantify demand versus “safe” supply
RAMF-SM and similar frameworks distinguish between total global supply and “safe” supply – volumes coming from jurisdictions and operators that meet specified political, ESG, and compliance criteria. Organisations frequently construct a simple equation: shortfall = internal demand – accessible safe supply.
One defence-sector case often cited involves dysprosium, essential for high-temperature permanent magnets. When demand for a programme was matched against non-Chinese dysprosium supply, a substantial percentage gap appeared, signalling that, under certain export-control scenarios, programme output would be constrained by access to this single element.
Such quantified shortfalls become the backbone of later mitigation scenarios, even though exact numbers are subject to uncertainty around project start dates, recovery rates, and policy shifts.
Step 6 – Evaluate mitigation pathways: substitution, diversification, efficiency
Once gaps are visible, material-by-material mitigation feasibility is analysed. Substitution assessments look at technical alternatives (for example, partial substitution of palladium with platinum in autocatalysts, or increased use of LFP chemistries that reduce cobalt dependence in batteries). Diversification explores whether credible additional “safe” sources exist-such as emerging projects like Piedmont Lithium’s Carolina operations or expansions at MP Materials’ Mountain Pass site.
Engineering constraints are critical here. For some applications, switching from NdFeB magnets to ferrite or from indium-tin-oxide to alternative transparent conductors implies performance tradeoffs or lengthy requalification cycles. Several electronics programmes have found that substituting indium requires 12 months or more of testing and customer validation, effectively ruling it out as an emergency lever.
Recycling and material efficiency are also evaluated. PGM recycling plants in Europe and North America, for instance, can alleviate primary supply constraints but are themselves constrained by scrap availability and regulatory approvals.
Step 7 – Score and prioritise risks across materials and products
With mitigation options characterised, most organisations then re-score each material and key supplier to create a prioritised risk register. Tools from Failure Modes and Effects Analysis (FMEA) are commonly adapted: for each critical material, teams list failure modes (export ban, mine flood, ESG-driven customer rejection, sudden regulatory restriction) and assign severity, occurrence, and detectability scores.
Cobalt linked to high-risk jurisdictions, gallium subject to export control, and single-source palladium from assets like Nornickel’s Russian operations often feature near the top of such lists. The output is not a plan but a ranking: which material-supplier combinations create systemic exposure and therefore deserve more detailed contingency work.
Step 8 – Document risk treatment approaches
At this point, treatment approaches are usually grouped into four descriptive buckets observed in supply-chain risk literature: accept, mitigate, avoid, and transfer. For some low-volume, easily stockpiled materials, organisations consciously accept exposure. For others, mitigation may involve qualifying a second refining route, shifting to a supplier in a different jurisdiction, or engaging in long-term collaboration with existing suppliers to improve ESG and compliance performance.
In high-risk contexts, some companies have chosen to avoid particular processing hubs entirely—for example, stipulating that REE separation be performed outside China, even if ore originates elsewhere. Risk transfer tools such as political-risk or marine insurance are occasionally used to manage logistics-related events (for instance, Red Sea disruptions affecting concentrate shipments), although these instruments do not address the underlying physical scarcity of material.
Another observed practice is the use of blended provenance certificates, where recycled and primary material streams are commingled. While such approaches can keep production flowing and improve average ESG performance, they can also cloud traceability and complicate UFLPA or EU due-diligence demonstrations.
Step 9 – Establish monitoring, indicators, and governance
Exposure mapping is rarely treated as a one-off exercise. Organisations that have embedded it successfully tend to create standing governance structures: supply risk councils, dashboards that track exposure metrics, and defined triggers for management attention. Digital tools range from basic spreadsheets to specialised platforms integrating shipment data, ESG scores, and regulatory alerts.
Typical indicators include: percentage of volume for a given material processed in a single country; share of supply routed through sanctions-exposed logistics corridors; and exposure to entities appearing on UFLPA or other restricted lists. Monitoring expansion projects—such as MP Materials’ announced capacity increases or new refining projects in Australia and Europe—also helps calibrate how “safe” supply might evolve over a three- to five-year horizon.
Step 10 – Review, report, and iterate
The final step in the cycle involves formal review and reporting. Annual or semi-annual updates are common, with material exposure maps feeding into board-level risk reviews, sustainability reports, and, where relevant, defence or automotive regulatory submissions. Experience across several sectors suggests that exposures can shift quickly: a single new export restriction, tailings incident, or ESG scandal can reconfigure the risk profile of an entire material category.
In adapted applications of RAMF-SM and similar frameworks, some organisations have reported reductions in quantified exposure on the order of 30–50% within 12 months, primarily by diversifying “safe” sources, advancing recycling programmes, or reconfiguring product designs for lower dependence on the scarcest inputs. Those figures are highly context-specific, yet they illustrate the potential impact of systematically mapping and acting on strategic material exposures rather than treating them as a static background condition.
Across electronics, batteries, aerospace, and defence, a recurring pattern emerges: the most consequential insights often arise not from exotic modelling, but from the basic work of connecting internal BOM-level demand to real-world mines, smelters, and trade routes. The 10-step framework above captures how that work has been structured in practice, and which signals have tended to distinguish manageable concentration from systemic strategic vulnerability.
Anna K
Analyst and writer at Materials Dispatch, specializing in strategic materials and natural resources markets.


